
Downtown Cleveland
2025 Annual Report

This year, we unveiled the Greater Downtown Vision, a bold roadmap for confronting challenges and accelerating growth in Cleveland’s urban core over the next decade. The Greater Downtown Vision is rooted in the formula:
Safety + Activation + Connectivity = Growth
This annual report shares statistics in each of these pillars, as we move toward a growing, more resilient downtown.
Annual Data Snapshot

Foot Traffic + Population
Out-of-Market Visitors: 7.8M
Non-Resident Visits: 37.8M
Inbound Commuters: 95.3K (work downtown, live outside)
Residents: 21,000
Office Data
Average Occupancy:
Overall: 80.2%
Class A: 80.2%
Class B: 80.1%
Avg. Rent Office Space:
Overall: $20.84 psf
Class A: $24.29 psf
Class B: $18.34 psf
Significant Leases Signed in 2025:
Jones Day (30,622 SF) renewed - 1001 Lakeside Avenue
Roetzel and Andress LPA (19,855 SF) - 1375 E. 9th St.
SmarterX (11,600 SF) expanded 5,800 SF - 812 Huron Rd
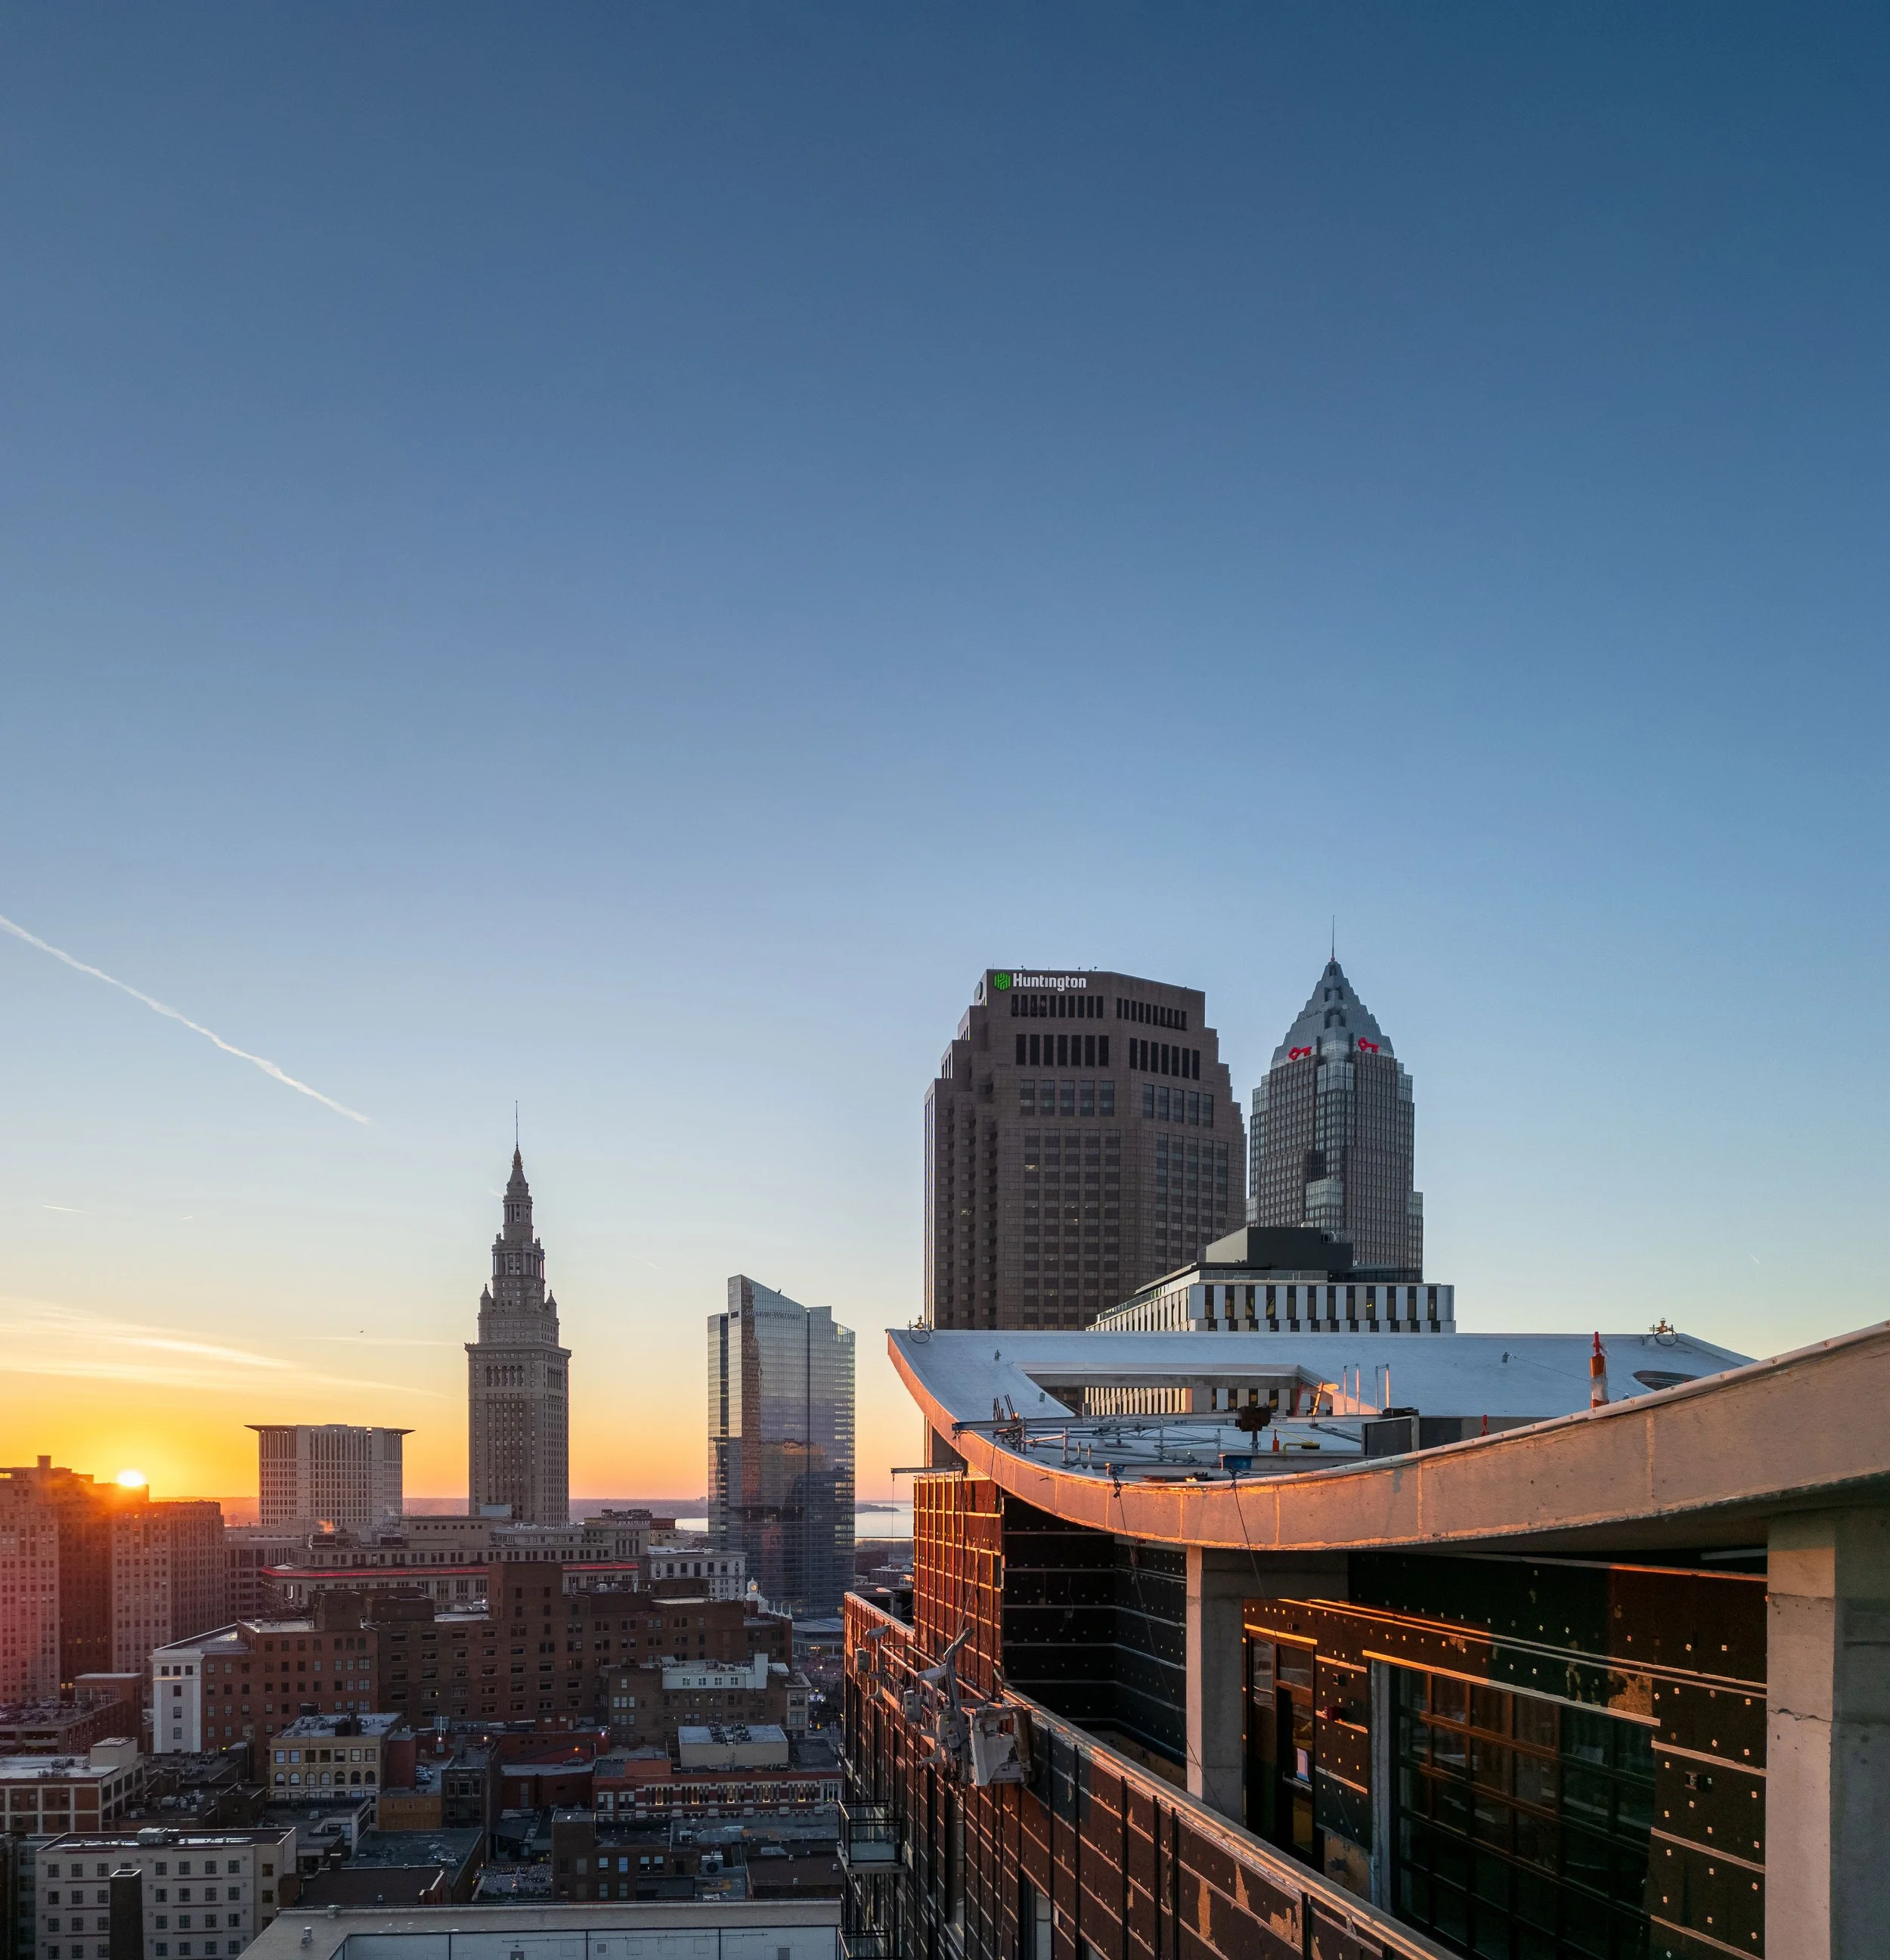
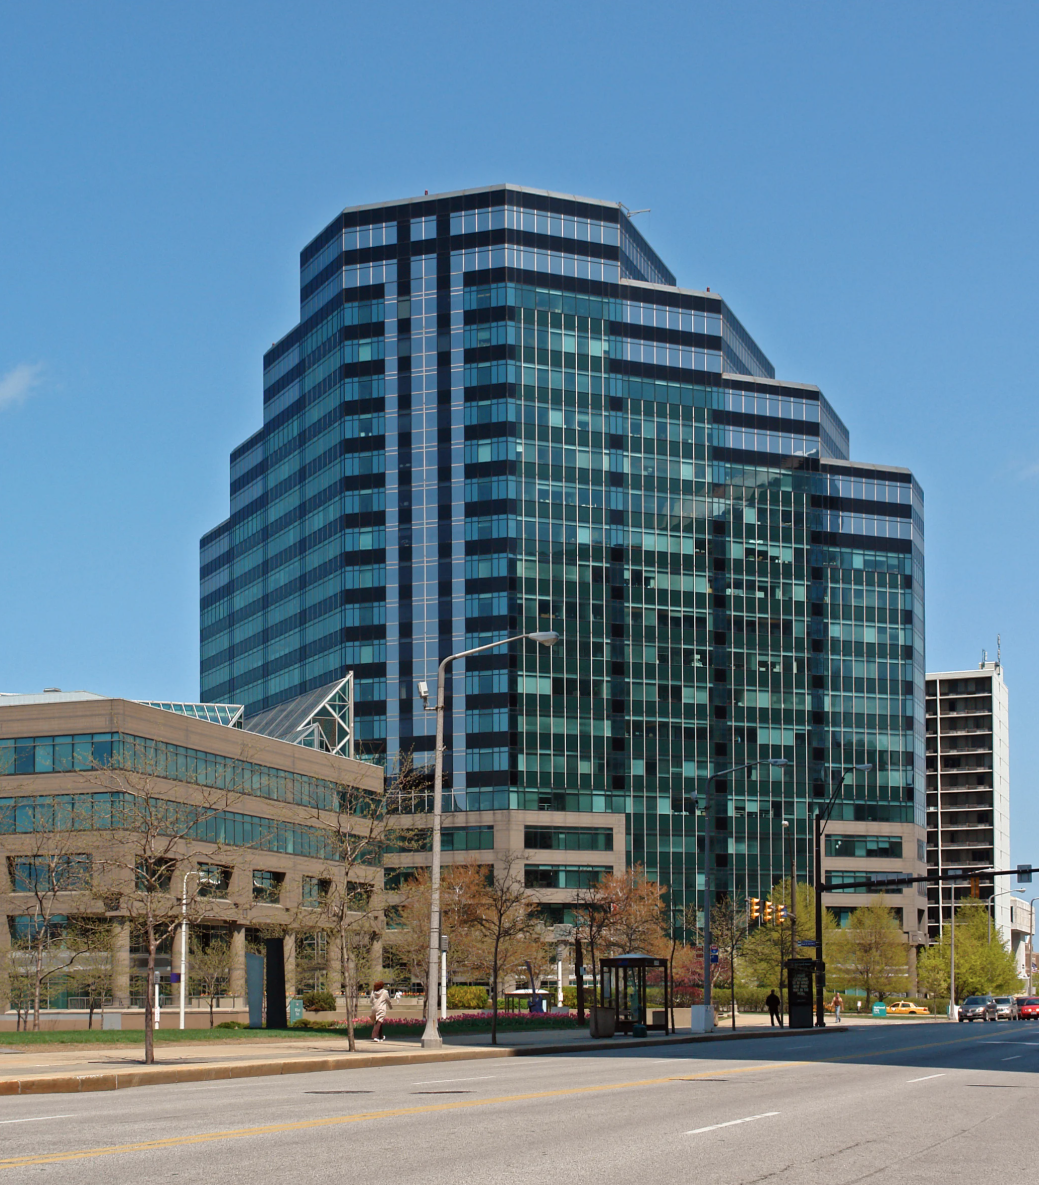
Development
$4.9B Underway + Planned In Development:
700 Prospect
The Rose Building
Globe Iron
Flour Mill project
Rock Hall Expansion
Residential
Apartment Occupancy: 86%
Hospitality
Avg. Hotel Occupancy Rate: 62.8%
Avg. Daily Rate: $187.19
Avg. Revenue Per Available Room: $116.97
Public Realm
Over $100K Awarded for Planting Trees
28 Trees Planted in 2025
Retail
20 New Store Openings:


An Activated Downtown is a Magnetic Downtown
335 Activations in 2025
Estimated 67.2K Attendees
24.4K WinterLand Attendees
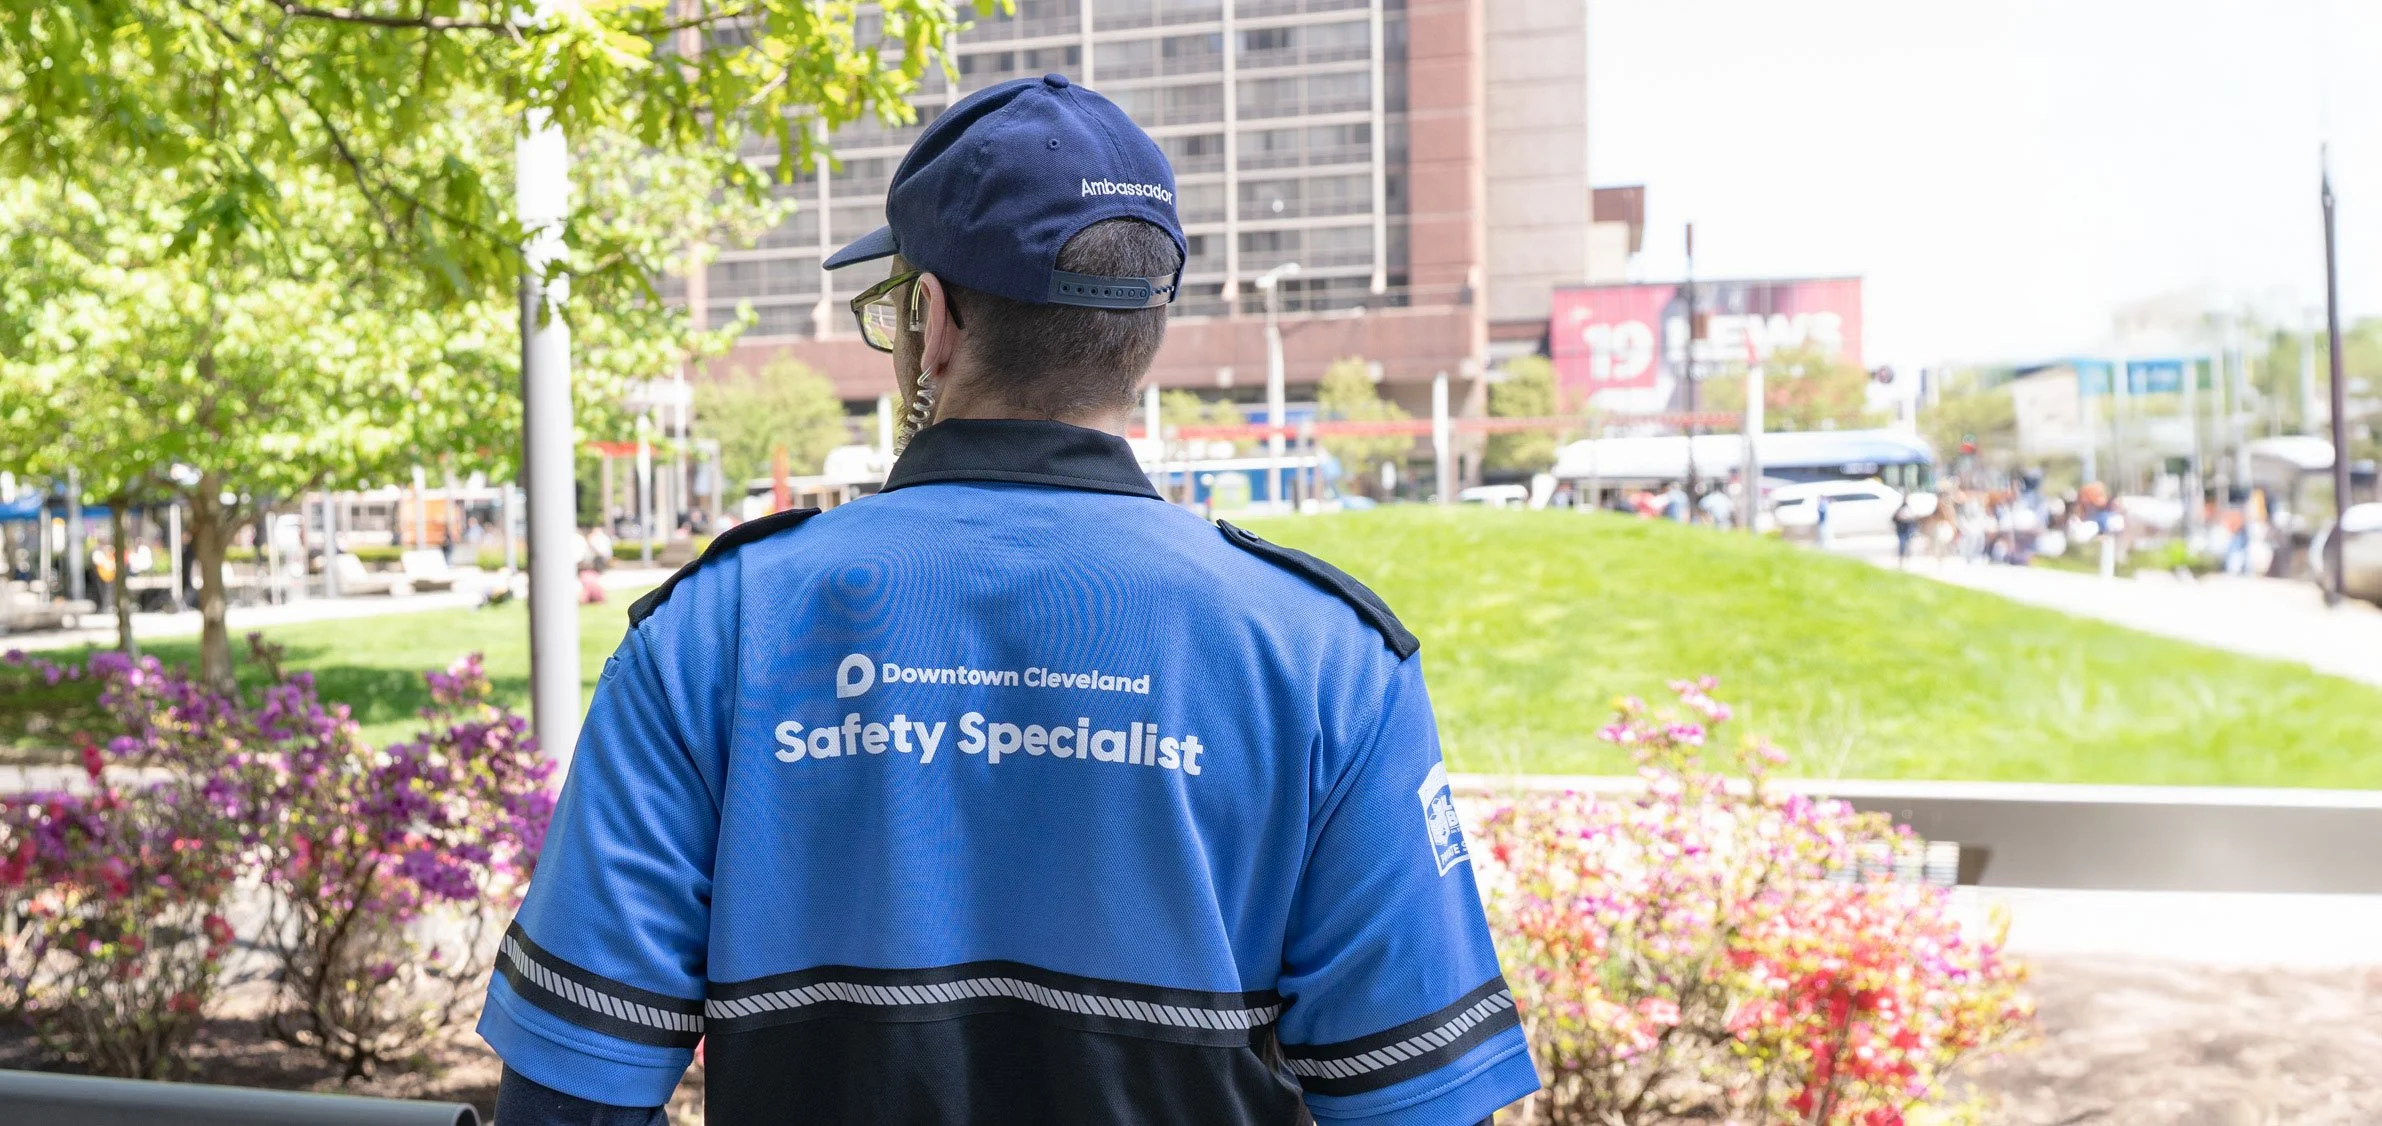
An Safe Downtown is a Strong Downtown
85 Housed in the Home for Every Neighbor Program for a Total of 188 Individuals Housed
759K+ Pounds of Trash Collected
13,232 Security Checks
3,120 Graffiti Tags Removed
417 Safety Escorts
250 Planters Maintained
28 Smart Security Cameras Added
An Connected Downtown is a Thriving Downtown
20.6M RTA Rides
4.2M Airport Passengers*
*Through October 2025